
An Example of Fluidic Pressure Data from a DNA Sequencing Machine using simple PCA & Clustering.
Data analysis workflows are absolutely crucial for each stage of development of modern instruments.
This blog post looks at:
- The steps of a data analysis workflow using a real example with systematic data analysis by means of principal component analyis (PCA) and clustering.
- How simple algorithms can be used to generate models from data that are difficult or expensive to generate using first principles.
- How models can be used to detect outliers, e.g., clogged fluidic paths, variations in viscosity, and even coding errors.
- Use of rapid prototype tools and report generation to disseminate findings quickly for more agile system development.
Introduction
Data analysis workflows are invaluable tools used to understand the instrument and to gain insight into problems that not even the smartest scientists will be aware of at first glance. If analysis does not take place during development there is a huge risk that issues will only come to light when they occur in the field.
The usefulness of rapid prototyping tools and report generation allows for rapid dissemination of information and facilitates communication between system architects, scientists, software and hardware developers, and also users. This enables even faster agile development and more robust product development.
The benefit of a real study is that we can demonstrate how to carry out clever “statistical software debugging” to test the latest hardware implementations and to find potential bugs before system verification takes place.
Experiment background
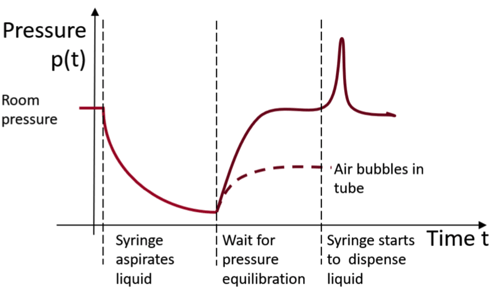
Reagents are delivered via specific fluidic paths in our DNA sequencer, whereby a syringe aspirates liquid and dispenses it into the desired locations. This is carried out by the action of certain valves so that the reagent is in a so-called flow cell where sequencing takes place.
Good practice means you have to think in advance about what may happen to the readings when the syringe aspirates and dispenses liquids, so a model is needed for this.
In theory, it is possible to resort to detailed modeling to work out how the pressure will behave. This involves using all the fluid dynamics and coming up with lots of assumptions or going to finite element simulations.
But, as engineers are constantly under time pressure, just thinking qualitatively about Bernoulli’s equation that static and dynamic pressure should be roughly constant is more than sufficient to come up with a pressure curve graph.
Data acquisition
The DNA sequencer writes the data into time-stamped entries in an ASCII logfile, so it is easy to collectand display it.
Luckily, someone once wrote a parser to extract the more meaningful data into .csv-files.
So it should be really easy, but what was the context again? Which sensor data-sample files belong to which fluidic path on which instrument and in which experiment?
Here, statistics come into play: engineers need to become statisticians and perform proper data collection, with cleanup and visualization.
If you have heard sentences such as, “We have a lot of data, just show us the results.” shrug your shoulders like a true Dilbert, as you know that data acquisition and cleanup will probably take up the majority of the time of the whole analysis. Still the old saying “garbage in, garbage out” holds. Therefore, the aim is to avoid garbage data.
Storage, querying, and analysis of data requires the right tools for the job – PowerPoint, Word, and other favorites of the manager have no place here. These tasks are best performed using more adequate tools like MATLAB or R.
In this blog post, MATLAB with its inbuilt report generator is used to quickly generate a technical report that can be shared with colleagues – just remember the report is not a glossy sales brochure and there is a good chance it may contain formula!
First steps in the data analysis workflow
1. Background and experiment description
This is what we have done so far but we will do it in MATLAB again.
2. Data acquisition
Load data preferably into a table format where
-
-
rows correspond to single data records and
-
columns correspond to variables which describe an entity
-
Store table data in fast loading and universal file formats such as HDF5 (e.g. latest MATLAB’s .mat-format) so parameters and algorithms can be quickly tested with larger datasets and different parameters and algorithms)
-
3. Cleanup
Sensor signals always contain sensor noise that is analog or digital in nature from physical sensing or discretization, respectively.
Cropping, resampling, noise removal (filtering, e.g., moving the average or using a Savitzky-Golay FIR smoothing filter) are standard procedures that you can apply and which are preferably switched on and off, also with different parameters, to get a feeling for the impact of this cleanup.
4. Data visualization & algorithms: Data exploration
Here, first analytical algorithms are used to investigate the data and display the initial results to gain insights into the problem.
5. Statitical analysis, model building
At this stage, you have data that you understand and that you can investigate if other artefacts or patterns are found, e.g., clogged fluidc paths due to various chemicals and their viscosities.
Conclusions
Data analysis workflows are essential to understand the instrument and to gain insight into problems. Timing issues in valve selection, incorrectly stored data, and substantial changes over time, and even during one experiment, were observed. This was surprising as we thought this might occur only with long-term use of the instrument, if at all. Systematic data analysis workflows are crucial during all stages of product development and testing phases:
Development
Anomality tests very often indicate bugs or hardware that is not functioning correctly.
Biases show incorrect adjustments, workpoints, and achievable accuracy.
Variablilty shows instability of methods, instruments, and achievable precision.
Subsystem tests
Help to breakdown complexity to better understand the complete system.
Isololate problems for root cause findings.
Integration test
-
Reveal incompatible interfaces on a semantic level and not just a syntactic level.
-
Find hidden confounders that may influence different subsystems.
Verification tests
-
Show intended usability and functioning.
-
KPIs such as: Instrument accuracy, precsion, and sensitivity. Early problem identification in development also helps also to control other KPIs such as time-to-market and cost. Faults in verifications tests are an order of magnitude more expensive than if they had been detected in earlier project phases.
All of these tests show the same data analysis workflow and can be refined and adapted to grow with the project stage and majurity. By starting with statistical data analysis, the development remains in line with project goals on all levels.
In this particular example, we observed in the early stages of development that several software and firmware bugs were detected easily and more rapidly with data analysis than with code reviews or debugging the software. This is what we call “statistical software debugging”.
Model building in steps 4 and 5 also allows for surveillance of instrument behavior, process stability, machine-to-machine variance, and often enables statements about instrument accuracy, precision, and sensitivity to be made.
This helps to improve overall design for a faster time-to-market, more reliable instrument and, eventually, to higher profitability as key performance indicators can be estimated from early stages of product development and any deviations are picked up as early as possible. In the above case, variations in single runs were detected where scientists believed that they may only occur over longer periods of time or variations in fluidic viscosisties show up in the analysis by only measuring pressure in fluidic paths.
Outlook, further potential
Further refinements in the analysis may lead to predictive maintenance procedures that would prevent clogging of fluidic paths when abnormal pressure data are detected and then (automatic) maintenance routines are scheduled before intervention by the user or even service personnel is needed.
